
Hydraulic conductivity testing was carried out by GE Monitoring Systems (Pty) Ltd under contract to KoBold Metals and Mingomba Mining Limited.
The program was designed and led by Vanessa Nenna, Staff Data Scientist, and Judah Zulu, Field Hydrogeologist, at KoBold Metals, who directed testing operations on site alongside the GE Monitoring Systems field team. GE Monitoring Systems was on site from March to August 2025. Judah Zulu was trained by GE Monitoring Systems and is leading ongoing hydraulic conductivity testing.
The program delivered depth-discrete hydraulic conductivity profiles for all four shaft pilot holes using dual-method data (step-rate injection and falling head) at every test interval. These are the first measurements in the region to resolve K (permeability) at the individual stratigraphic unit level.
The results now serve as the supervised training input for KoBold’s KoreSight deep learning model, enabling extrapolation of K along the full borehole length for shaft ingress modelling, dewatering system design, and pre-sink grouting planning.
Injection testing is a hydrologic tool for characterizing hydraulic conductivity on the order of meters away from a wellbore. Two types of injection tests can be conducted with packers: constant rate injection and step-rate injection, also known as Lugeon tests.
Constant rate injection tests are used to estimate the hydraulic conductivity of a layer. Step-rate tests also provide estimates of hydraulic conductivity, and a hysteresis profile that can be used to identify fractures and other structures near the wellbore. Repeating these tests at multiple intervals down a well allows for characterization of the vertical variability in lateral flow rates into the wellbore and the total amount and rate of water inflow as a function of depth.
Packers were used to isolate sections of each major unit along a shaft pilot hole to identify zones of high hydraulic conductivity that are likely to deliver greater water inflows to the shaft during development at the new Mingomba mine site. Measurements can be used directly to aid in planning the shaft sinking program. Additionally, they provide important information on the relative conductivity of hydrostratigraphic units vertically. To date, most modeling efforts at the site have lumped several units into single values of hydraulic conductivity and assumed a uniform delivery of water over hundreds of meters. These injection tests are the first in the region that measure the flow rate of individual units and give a more realistic view of the vertical variability in hydraulic conductivity.
Step rate injection tests were completed in four production and ventilation shaft pilot holes: KN244, KN248, KN257 and KN259. The methodology described below was applied to tests from all test intervals in all four pilot holes. The test interval length varied between 9m and 50m. In all cases the length of the test interval was significantly larger than the borehole diameter, allowing for a simplified representation of the K(Q,H) relationship described below.
For one representative test, a single packer was placed at 1333m below ground surface with the bottom of the hole at 1342m, creating a 9m test interval. The hole outer diameter was 0.096m while the inner diameter of the rods was 0.078m. Rod loss was calculated by injecting at 40m, 60m, and 100m of pressure while the packer was closed to prevent injection into the open hole interval below the packer. The flow rate increased with pressure, producing a linear relationship for rod loss given by:

where q_loss is the flow rate through the rods and p_inj is the injection pressure. Values in brackets denote the units. This relationship was used to correct the flow rate during the step rate injection test, which operated at 50m, 100m and 150m of injection pressure at surface. The corresponding downhole flow rates varied between 3e-4 and 8e-4 m³/s during the test.
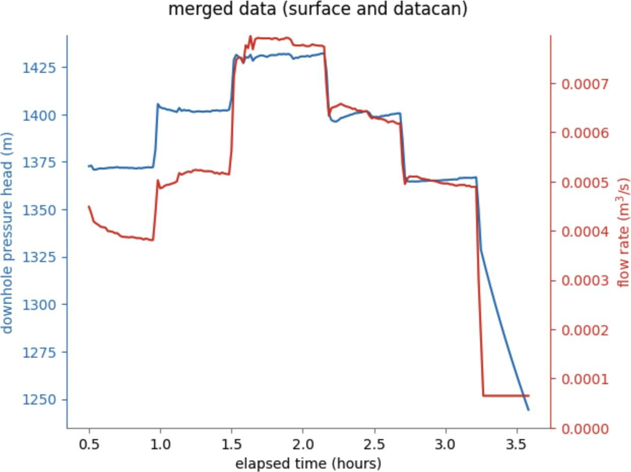
Figure 1: Merged surface and Datacan data for step-rate injection test at KN244, 1,333 m.
Downhole pressure was recorded using a Datacan logger, and showed changes in downhole pressure head between 1360m and 1430m. The Q-H plot per stage for the test is shown below. This test shows significant over-proportionality, suggesting most flow is through fractures propped open by the injection process that then collapse as the injection pressure declines. There is also significant hysteresis, with greater flow rates at later stages for similar excess head.
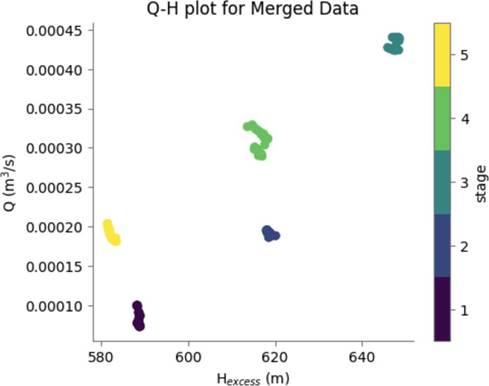
Figure 2: Q-H plot for the KN244 test at 1,333 m, coloured by stage.
From the Q-H relationship the estimated hydraulic conductivity of the unit is calculated according to Hvorslev (1951) of the form:
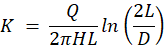
is the hydraulic conductivity;
is the injection rate;
is the recorded excess head;
is the borehole diameter;
is the length of the test section. The equation above is fit for all measured Q-H pairs with an optimization routine that provides an estimate of both the hydraulic conductivity per stage with uncertainty, and the overall hydraulic conductivity of the test section with uncertainty. The results for the test above are given in the following table.
| Stage | Estimated K (m/d) | Standard Deviation (m/d) |
| 1 | 0.001 | 0.00005 |
| 2 | 0.003 | 0.00001 |
| 3 | 0.005 | 0.00002 |
| 4 | 0.004 | 0.00004 |
| 5 | 0.003 | 0.00003 |
| All stages | 0.004 | 0.0002 |
Summary plots of estimated hydraulic conductivities from tests in all holes using the described methodology are plotted below. The colors in the background of the plots indicate stratigraphic intervals that are common across the holes. The red lines indicate the estimated hydraulic conductivity, and the length of the lines correspond to the vertical limits of the test interval. The hydraulic conductivity estimates show that there is significant variability vertically within each hole and between holes within a common stratigraphy.
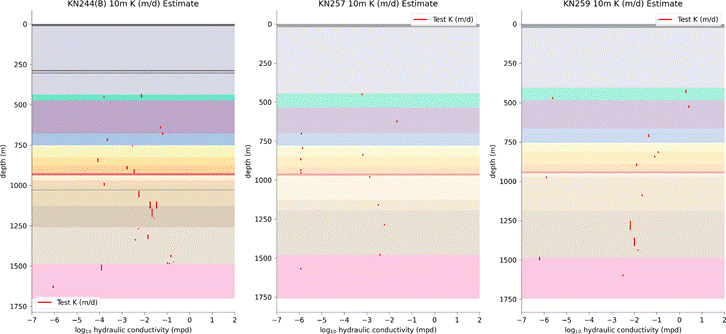
Figure 3: Summary hydraulic conductivity profiles for KN244(B), KN257, and KN259.
In addition to the step-rate injection program, GE Monitoring Systems performed falling head tests on every test section. With the packer already sealed and the tool in position, adding a falling head observation was straightforward and did not significantly extend the time per interval. This gave an independent check on the injection results using a different testing principle, and produced a second K dataset for every section. Having both methods at every interval gives considerably more confidence in the characterisation than either method on its own.
The team has also developed a methodology to use a computer vision machine learning model to estimate hydraulic conductivity along the entire borehole. All cores drilled by Mingomba Mining Limited are photographed under standardized conditions, allowing for the development of predictive computer vision models on the core. KoreSight is KoBold’s proprietary Convolutional Neural Net (CNN) Model that combines images, with wireline and stratigraphic logs, into a latent feature space that can be trained on any number of supervised outputs. The image below summarizes the KoreSight CNN model.
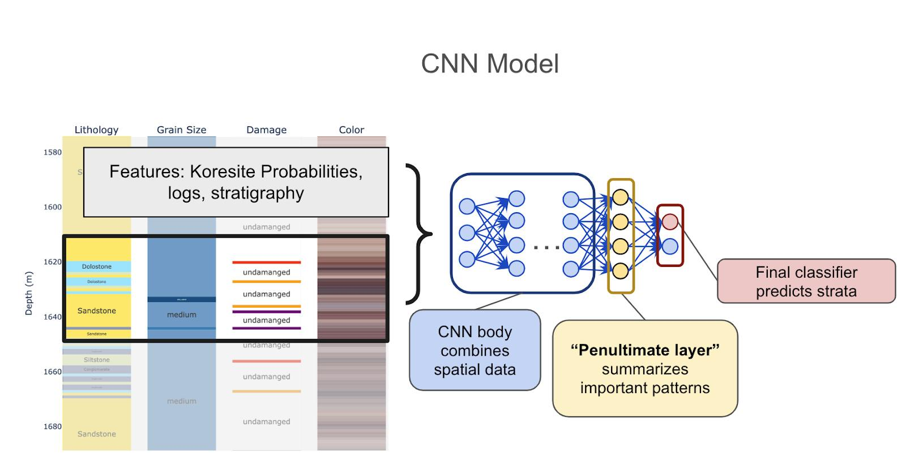
Figure 4: KoreSight CNN model architecture.
For this application, the important elements of this model are the flexibility of the input features and the “Penultimate layer.” The first allows us the option to incorporate logs specific to hydrogeology into the model. The “Penultimate layer” is a summary of all the important patterns from the combined spatial data. This layer is incredibly flexible and allows the model to be used to predict a range of final outputs, including structural, lithologic, or hydrogeologic properties, on new holes from a subset of the entire borehole set. With these models, a small number of hydrogeologic tests can be used to predict hydrogeologic properties across the exploration area for generating many different geologic scenarios in numerical simulations. The numerical models will be used to: 1) model many different scenarios of inflow into mine workings and 2) measure the robustness of different water handling strategies across the range of possible hydrogeologic scenarios.
The KoreSight model has been used to predict the hydraulic conductivity along the entire length of the above shaft pilot holes based on the similarity of each meter of core from the wellbore to all meters of core sampled with step rate injection testing. The hydraulic conductivity estimated for the most similar meter of a test interval is assigned to each meter of the borehole and the results are upscaled to 10m sections. Results of the KoreSight estimations relative to the estimated hydraulic conductivity from step-rate injection tests within each pilot hole are plotted below. Results below are upscaled to 10m intervals with the associated uncertainty, highlighting the variability of observed values.
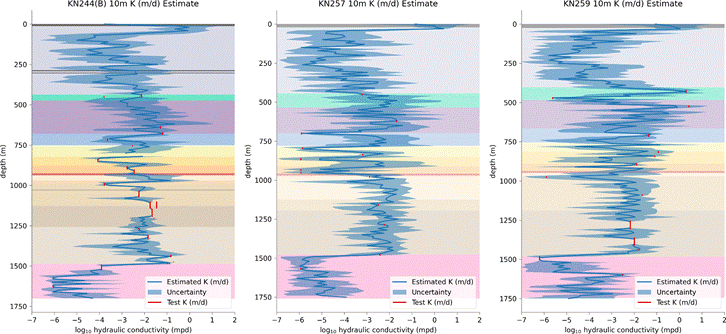
Figure 5: KoreSight K estimations versus measured packer test K for KN244(B), KN257, and KN259.
These average hydraulic conductivity logs are used to evaluate inflow rates to the shaft as a function of depth. An example of estimated ingress at the shaft based on simulation of extrapolated hydraulic conductivity is plotted below for KN244B. It suggests moderate flow over most of the shaft depth punctuated by zones of extremely high rates of ingress. These evaluations are being used for design of shaft dewatering and grouting strategies.

Figure 6: Estimated water inflow at KN244 as a function of depth.
The water table at Mingomba sits approximately 500 m below ground surface, and this dominated every aspect of testing. The first 500 m of each hole was completely dry. That meant the drill string was full of water while the annulus above the water table was largely empty. This hydrostatic imbalance was present throughout every test cycle and affected every stage of tool operation.
The IPI STX 60 is a four-stage mechanical setting tool. It is operated by physically stroking the drill rods through discrete positions: Stage 1 (inflation/deflation at datum), Stage 2 (circulation, 250 mm stroke), Stage 3 (full shut-in, +125 mm), and Stage 4 (injection/inflow, +125 mm). The first problem was getting the tool out of Stage 1. Under the hydrostatic conditions at Mingomba, every initial test failed at this point. The water column in the rods, acting against the dry annulus, created a pressure differential that prevented a clean transition out of inflation mode. GE Monitoring Systems developed a site-specific procedure to reliably get past this transition, and it was used on every subsequent test.
Each subsequent mode change carried the same risk. Moving between injection and falling head observation meant maintaining the packer seal while manipulating the tool through its stages under persistent hydrostatic load. If the seal was lost mid-test, the entire interval had to be re-done. Deflation was similarly challenged: the hydrostatic differential actively worked to keep the packers inflated, and releasing them required careful equalisation of the water column between the rods and annulus.
At test depths exceeding 1,300 m in PQ and HQ holes, the risk of dropping or losing downhole equipment was a constant concern. Rod leak testing was performed at every interval by injecting at stepped pressures while in inflation mode and recording surface flow. At these depths, even minor rod leaks introduce significant error into flow rate measurements, so the leak correction for each interval was applied to all subsequent test data from that section.
Being on site for six months gave GE Monitoring Systems the opportunity to progressively train on-site personnel to operate the STX 60 on their own. Training covered the full four-stage operating sequence, rod leak testing, packer maintenance and servicing, deflation procedures under Mingomba’s specific low-water-level conditions, and data capture using Datacan electronic memory gauges. On-site staff continued testing independently after GE Monitoring Systems demobilised in August 2025, with the program continuing to this day.